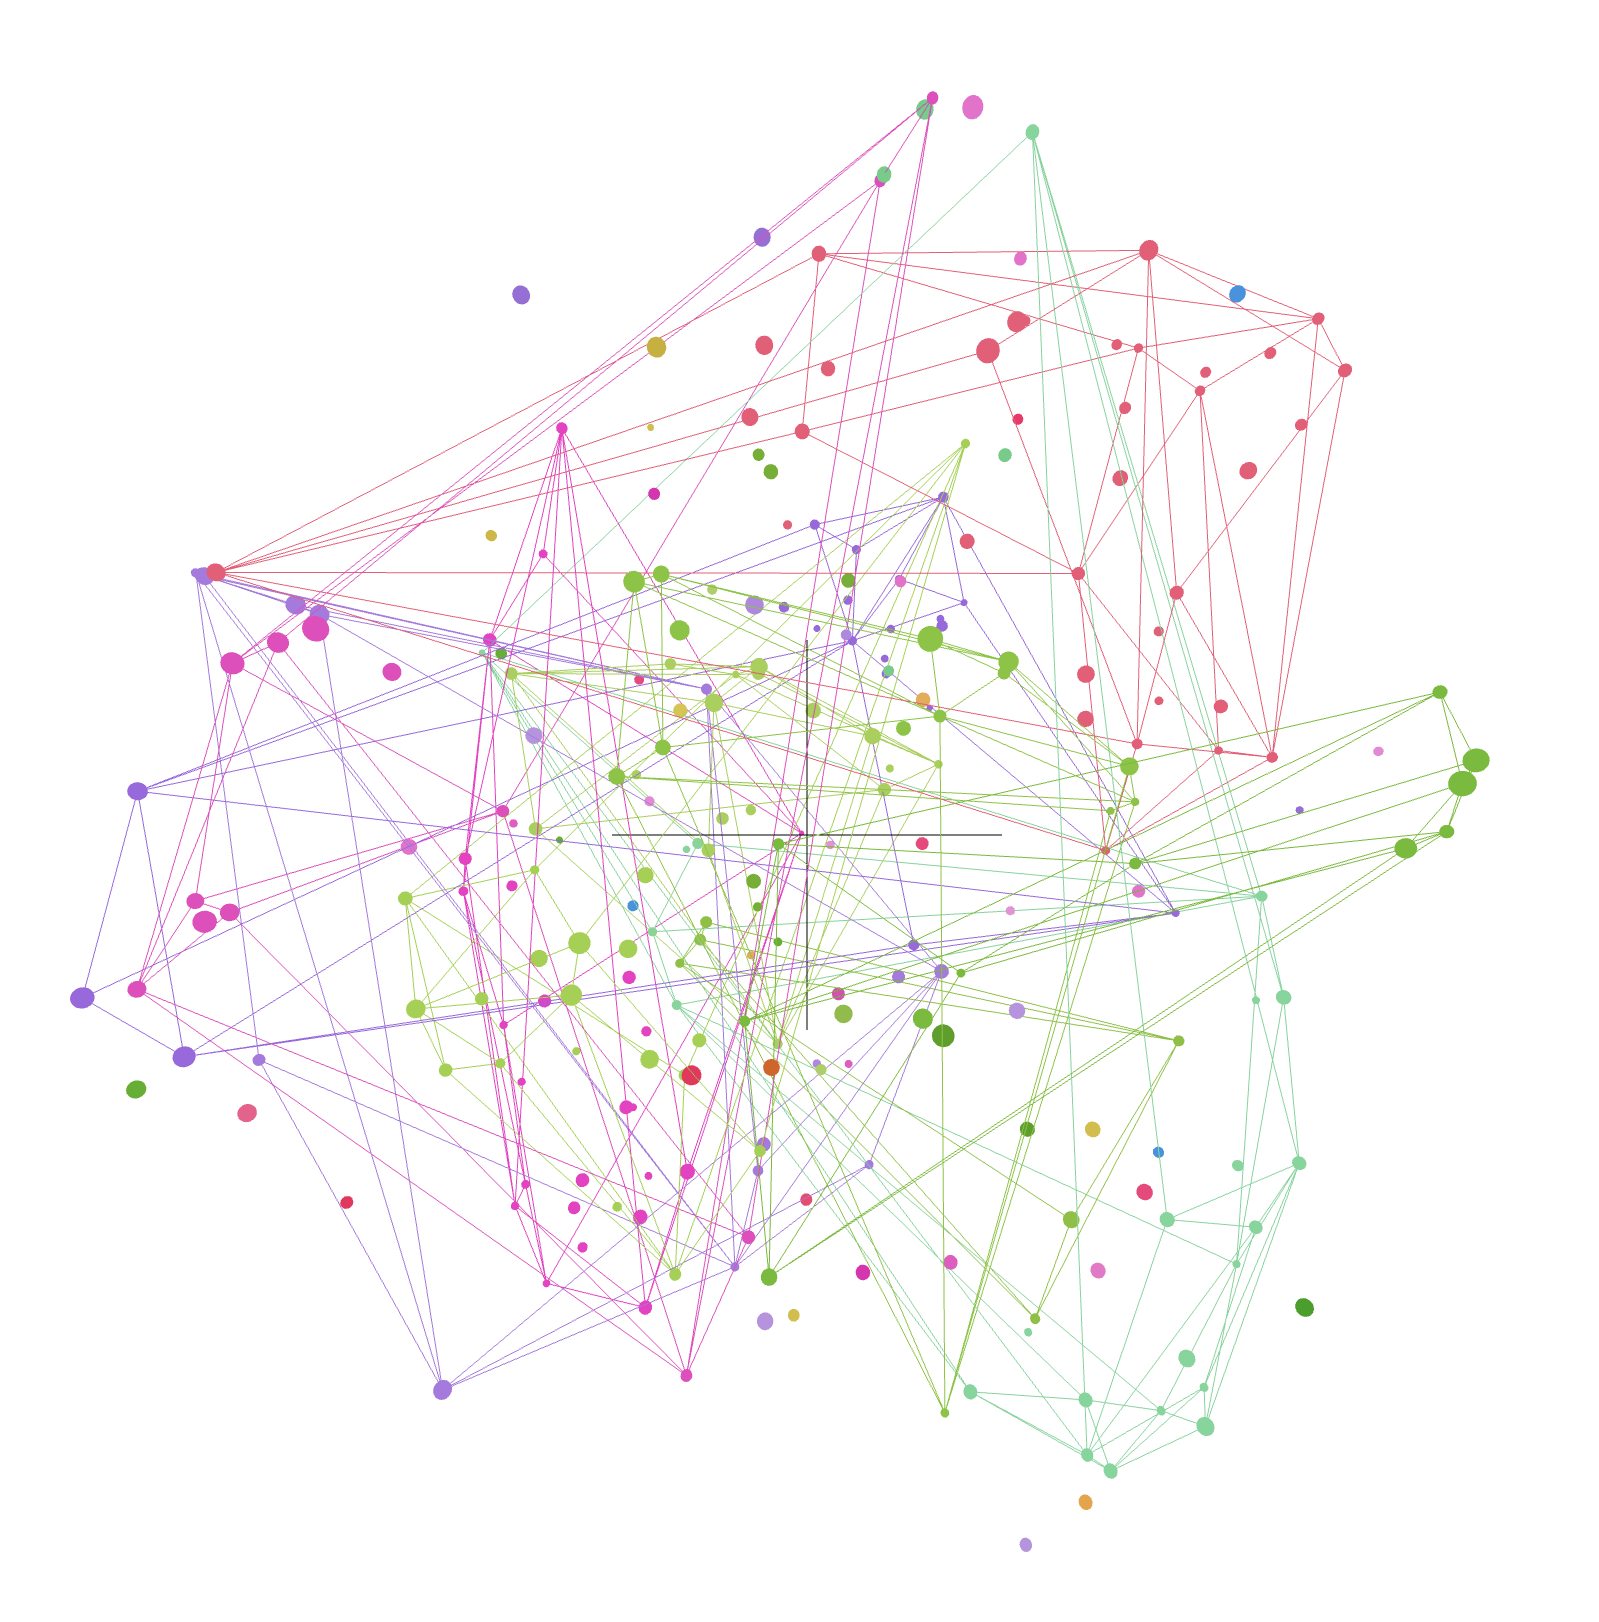

In the rapidly evolving landscape of big data, the ability to effectively analyze and visualize data is a critical asset. This is particularly true when dealing with advanced vector databases and embeddings like Chroma, where the sheer volume and complexity of data can be overwhelming. Enter LogicLoop, a cutting-edge data analysis and visualization tool that can significantly simplify this process, transforming raw data into actionable insights. Sign up here.

Chroma is an open-source, real-time vector search engine designed to handle large amounts of data. It employs machine learning to create vector representations of data, allowing for more efficient storage and faster, more accurate searches. The power of Chroma lies in its ability to understand the semantic relationships between data points, making it an excellent tool for complex data analysis tasks.
While Chroma's capabilities are impressive, extracting meaningful insights from the vast and complex data it handles can be challenging. This is where LogicLoop comes into play. As a data analysis and visualization tool, LogicLoop is designed to help users interpret their data, identify trends and patterns, and make data-driven decisions.

LogicLoop simplifies the process of analyzing large volumes of data. It automates many of the tasks involved in data analysis, such as data cleaning, transformation, and modeling. This not only saves time but also reduces the risk of errors, making the data analysis process more efficient and reliable.
LogicLoop transforms raw data into visually appealing and easy-to-understand formats, such as charts, graphs, and dashboards. These visualizations make it easier to identify trends and patterns in the data, which might be difficult to discern in raw, numerical data. With LogicLoop, you can bring your Chroma data to life and communicate your findings effectively.
By providing a clearer understanding of the data, LogicLoop enhances the decision-making process. It allows users to make data-driven decisions based on real-time insights, leading to more effective strategies and better outcomes. With LogicLoop and Chroma, you can turn your data into a strategic asset.
LogicLoop can significantly increase efficiency by automating repetitive tasks, freeing up time for more strategic activities. Plus, by providing real-time insights, it can help businesses respond more quickly to changes in their environment.
LogicLoop integrates seamlessly with Chroma, allowing users to leverage the power of Chroma's vector databases while benefiting from the simplicity and convenience of LogicLoop. Users can import data from Chroma into LogicLoop, analyze and visualize the data, and then export the results back into Chroma for further use.
In the world of big data, the ability to effectively analyze and visualize data is crucial. With the help of LogicLoop, users can harness the full power of Chroma vector databases, turning complex data into clear, actionable insights. Whether you're a data scientist, a business analyst, or a decision-maker, LogicLoop and Chroma can help you make the most of your data and drive your business forward.

